
Tier Meeting L3
Introduction
The Tier 3 board is designed for plant-level management, aggregating operational data by facility (plant) and week. The module provides a centralized view:
Upper section: daily KPIs for the previous day (sourced from MES, ERP, or manual entry). Clicking any KPI reveals a detailed 7-day historical trend.
Lower section: operational hub for managing open actions and viewing global trends to distinguish isolated incidents from systemic issues.
Supports formalized meeting recording for traceability of decisions and assigned tasks.

Overview
Access the primary interface for the Tier Management L3 overview to begin the daily review process.

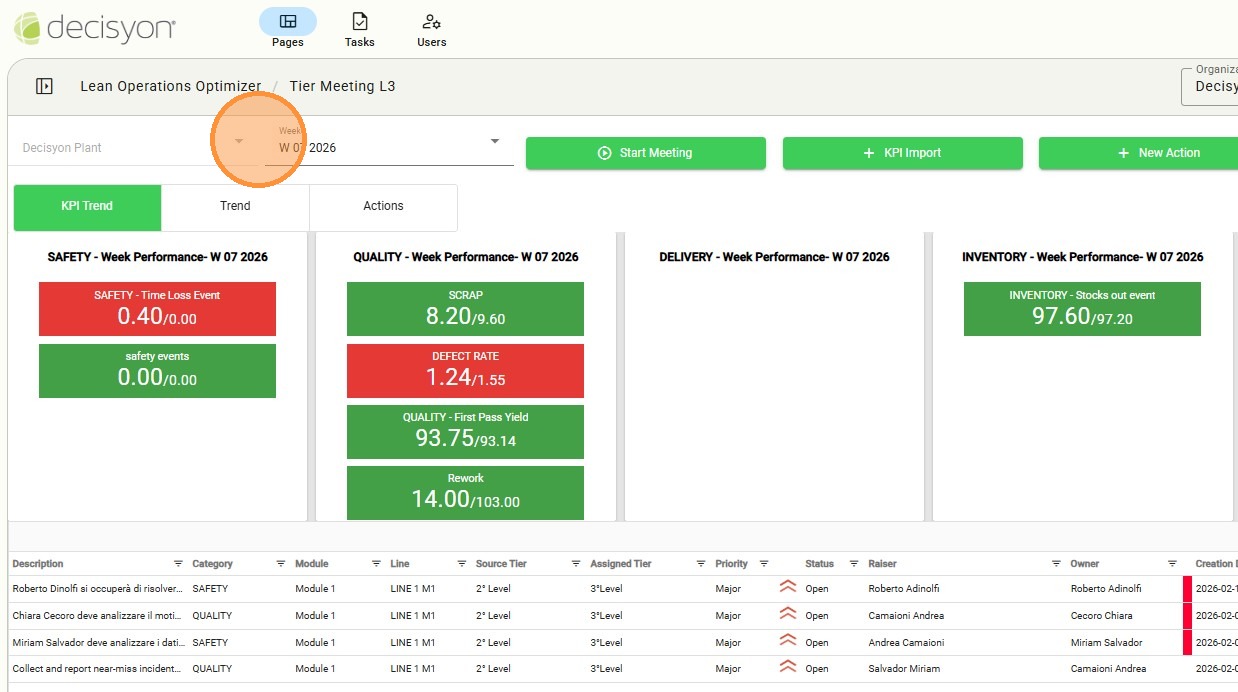
The upper section of the page features selectors to filter the displayed data:
Week: for the Tier L3 strategic analysis, the system allows users to select the specific week of interest, updating the dashboard to reflect the aggregated performance and periodic trends required for global governance.
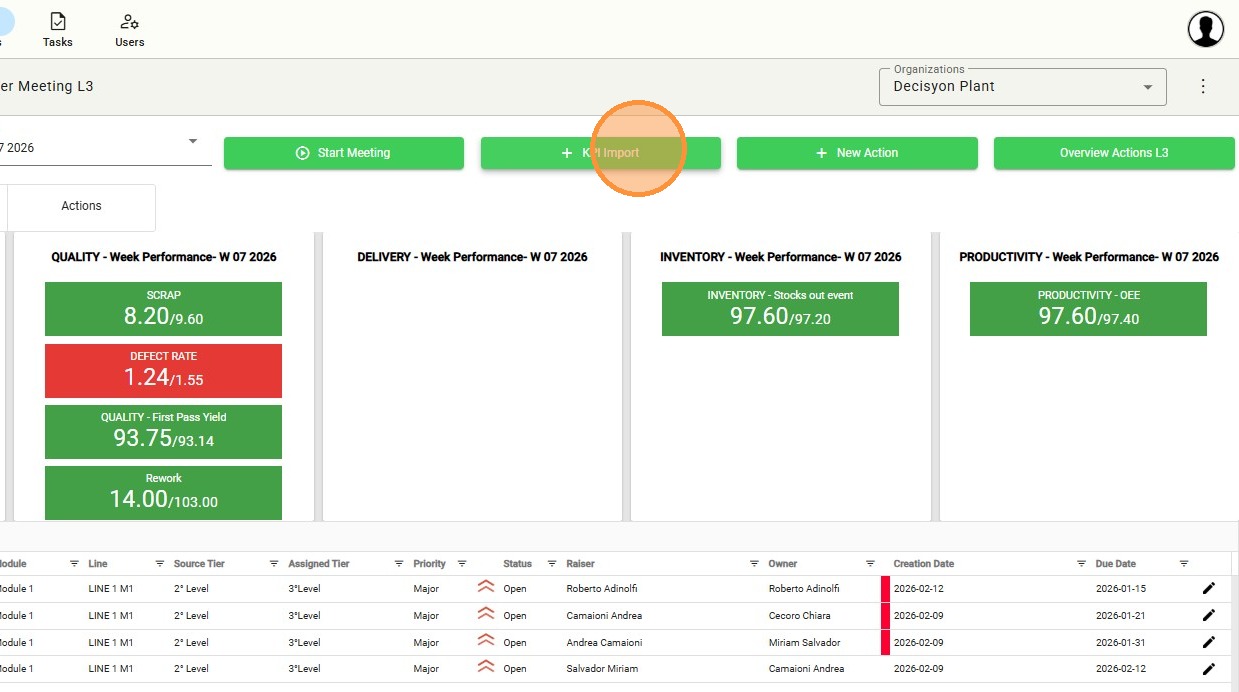
The control buttons allow for the following operations:
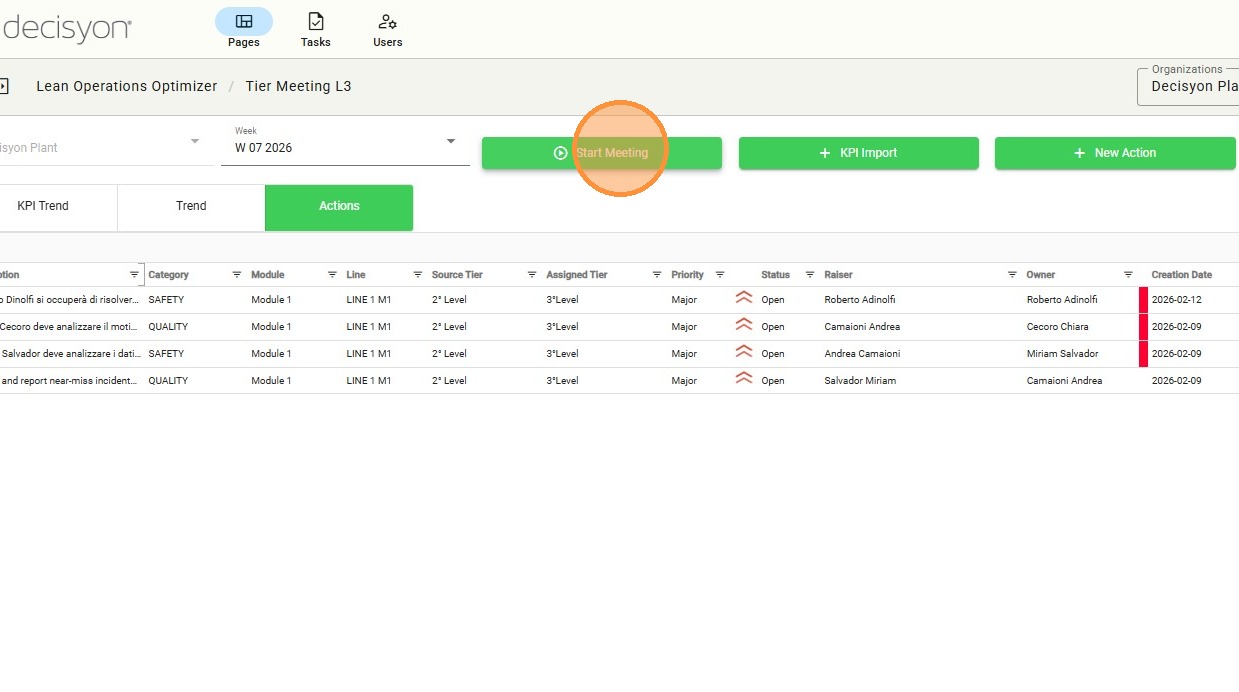
Start Meeting: used to formally initiate the recording of a new session, activating the data and time tracking system for the current meeting.
KPI Import: Use this tool to upload data via Excel or trigger manual synchronization of parameters.
New Action: Facilitate the immediate recording of tasks or issues identified during the meeting.
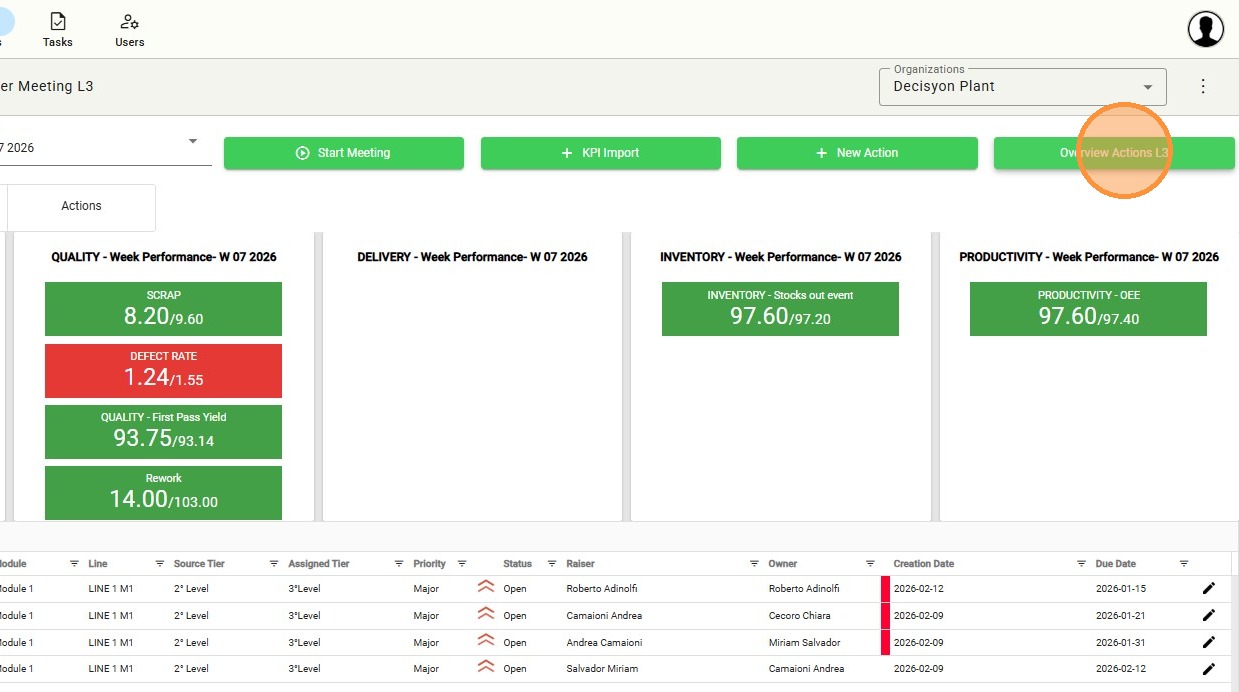
Overview Action L3: Access a detailed view of all tasks specific to the L3 level, showing status, priority, and responsibility.
The user can switch the dashboard focus by selecting:
KPI Trend: View the performance trends of various KPIs categorized by Safety, Quality, Delivery, and Inventory for the selected date.
Trend: Toggle to view historical performance trends and graphical representations of KPIs over time.
Actions: Switch the dashboard focus from KPI metrics to the list of open actions and tasks.
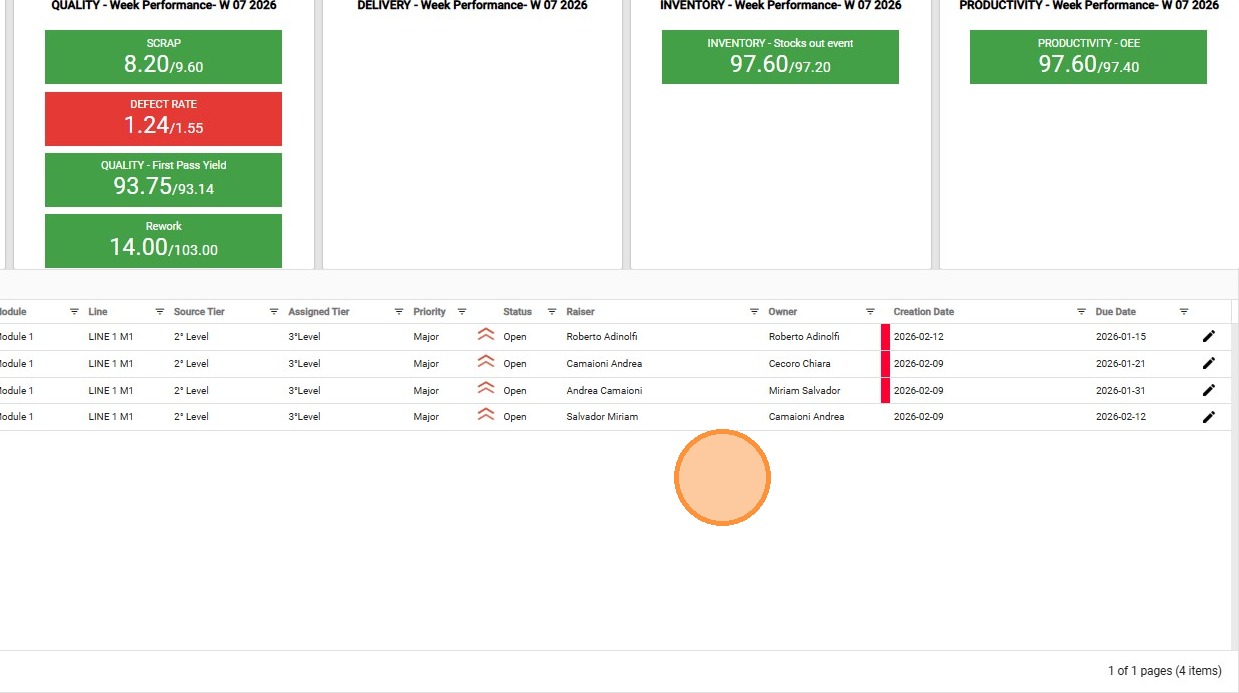
The bottom section of the page contains a summary table:
Issue List: Browse the table listing all issues with detailed information, including status and responsibility.
How To...
Define the Operational Context
Fot the Tier L3 level, the operational context is defined by selecting the specific week for review. This configuration allows the system to isolate the necessary timeframe for strategic analysis, updating the dashboard with aggregated data and weekly trends essential for overall plant governance.
Select Week
The main header displays the current plant name and the reference week (e.g., W 07 2026), providing an immediate overview of the analysis timeframe. This section serves as a quick-access control hub, allowing users to manage meeting sessions, import KPI data, and handle operational actions directly.
KPI Visualization and Analysis
After selecting the context parameters, the dashboard automatically updates the performance metrics displayed on the page. The system organizes data into primary categories, such as Safety, Quality, Delivery, and Inventory.
The user can switch the dashboard focus by selecting:
KPI Trend: View the performance trends of various KPIs categorized by Safety, Quality, Delivery, and Inventory for the selected date.
Trend: Toggle to view historical performance trends and graphical representations of KPIs over time.
Actions: Switch the dashboard focus from KPI metrics to the list of open actions and tasks.
For each category, users can monitor real-time performance metrics by comparing current values against set targets. For instance, the Delivery category displays the Return on Time value relative to its predefined goal.
KPI Trend
Data synchronization tool to pull latest metrics from external MES or manual entry sources into the L3 board.

The target review functionality enables the verification of established reference thresholds, such as quality scrap limits or defect rate goals, ensuring an immediate comparison between actual performance and predefined standards.
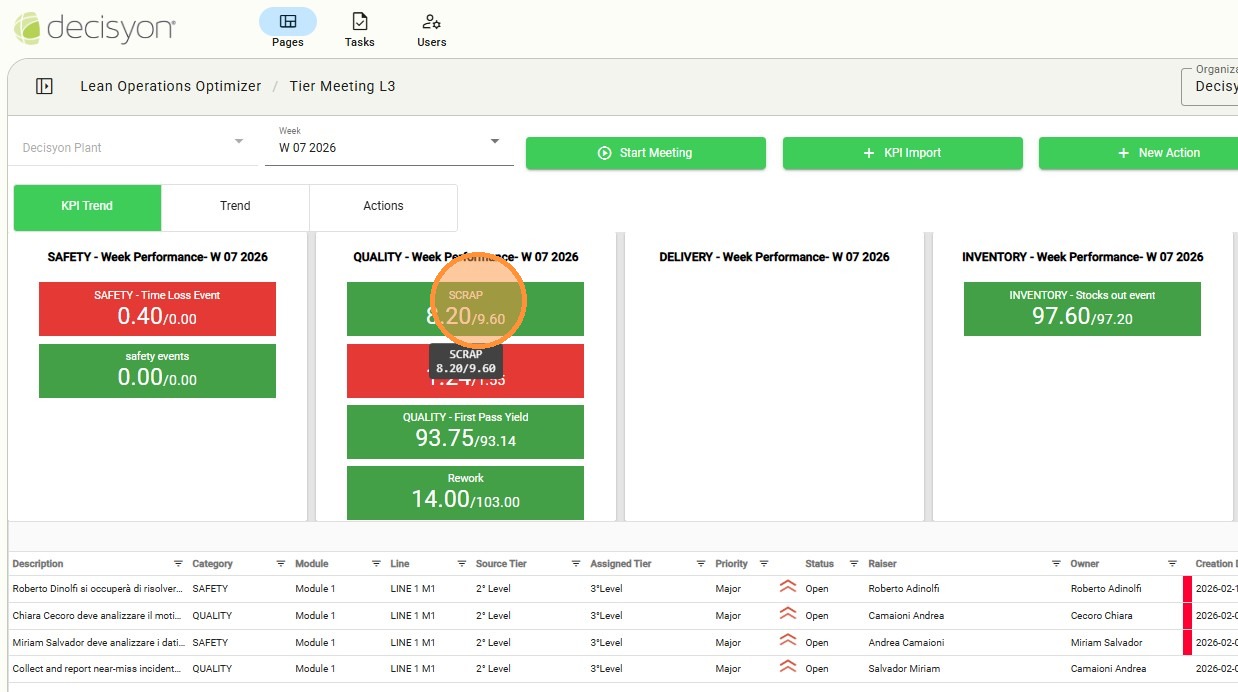
Accessing the indicator details allows for the examination of specific values across the various production lines within the selected module or area, providing a granular view of operational performance.

Trend
Toggle to view historical performance trends and graphical representations of KPIs over time. Actions TabSwitch the dashboard focus from KPI metrics to the list of open actions/tasks.

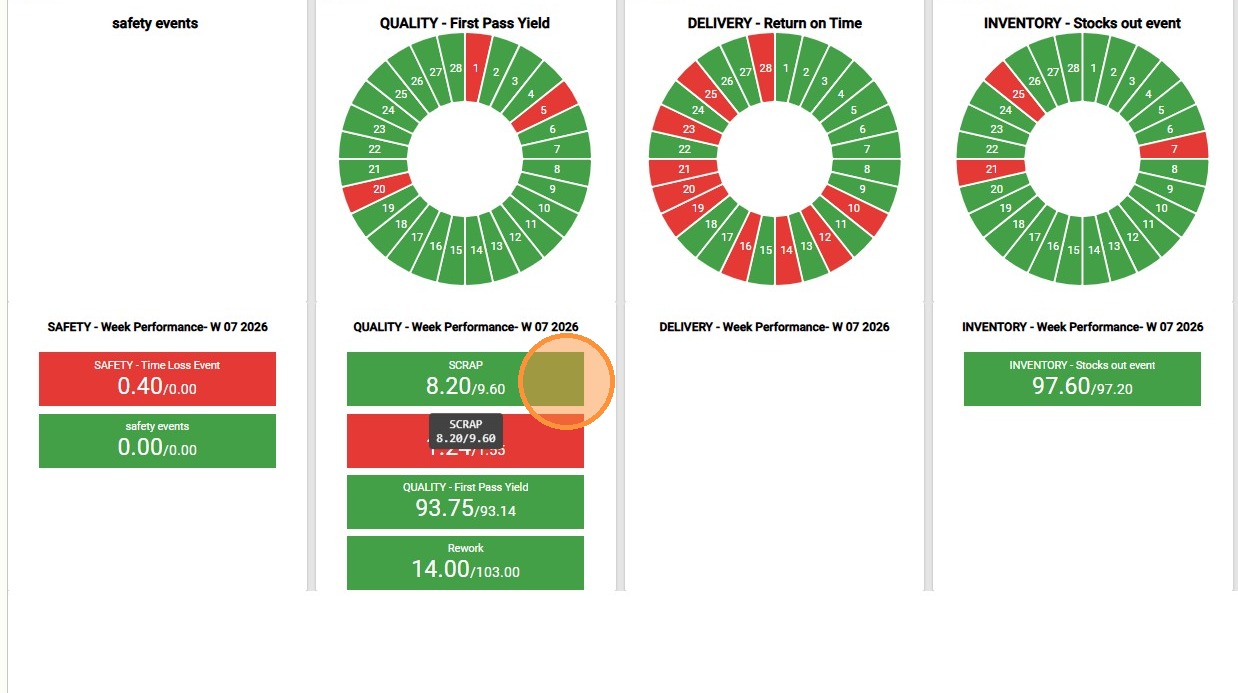
In the upper section, a donut chart displays the performance of the main KPI for each category (configured by the system administrator).
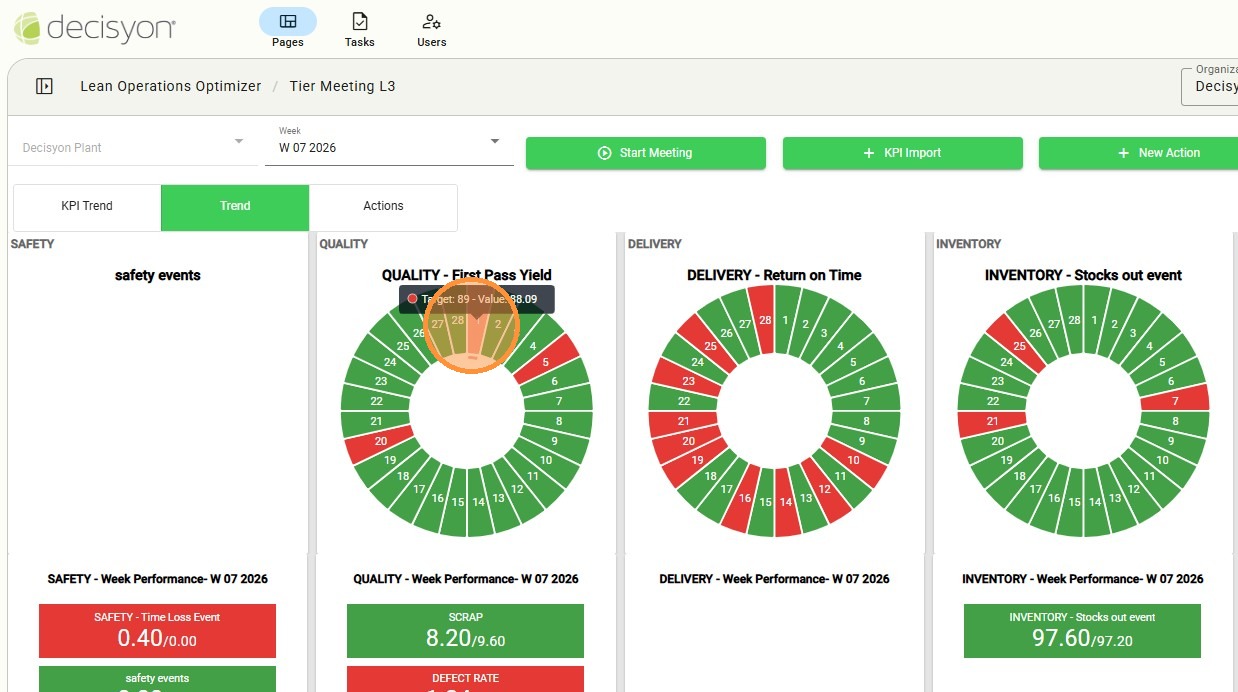
Clicking on a specific day in the chart opens the detailed view of all KPIs in the category for the current month.
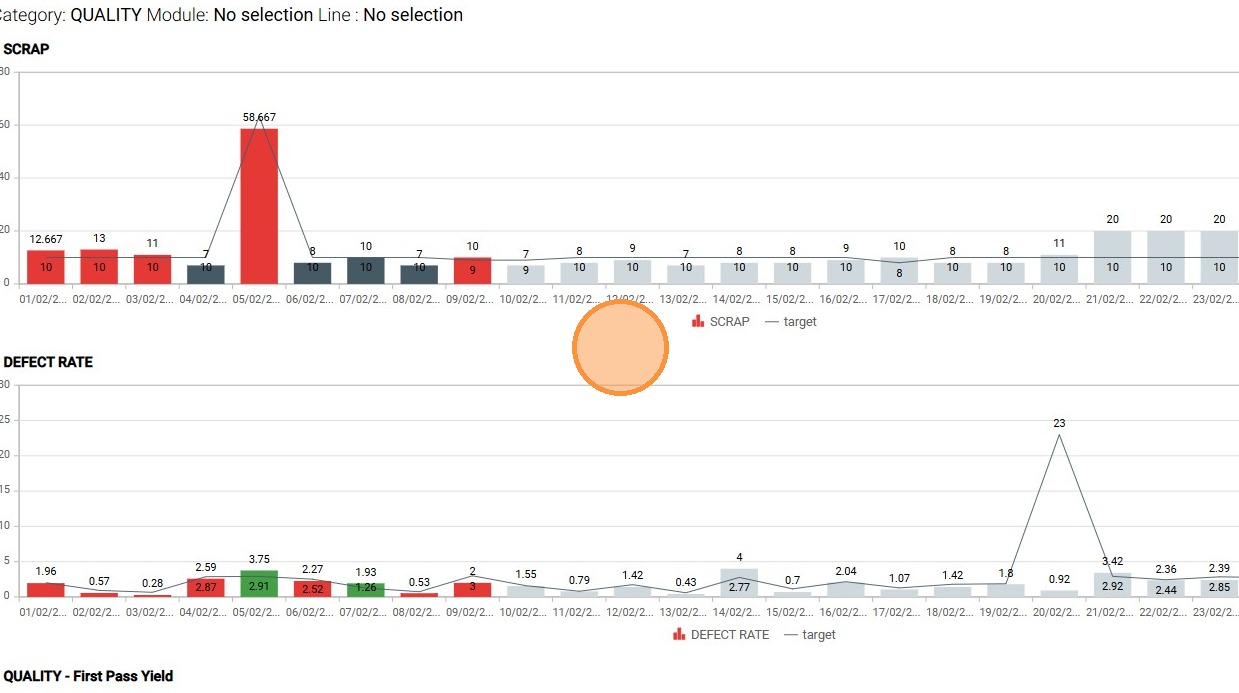
In the lower section, all KPIs associated with the category are listed.
Action List
The lower section of the Tier L3 dashboard displays a real-time overview of open actions for the day and facilitates the direct creation of new tasks during the meeting, ensuring that all priorities identified during the discussion are immediately recorded.
KPI Import Tool
Trigger the data synchronization process to pull the latest manual or automated KPI values into the Tierboard.
Within the KPI Import section, the system displays the full list of imported parameters for the selected context. For each item in the list, the interface allows for the direct management of operational data:
KPI Value: Enter or modify the current recorded value to monitor real-time performance.
KPI Target: Define or update target values to establish expected performance thresholds for each indicator.

Selecting the desired KPI enables the value editing mode and displays a dedicated toolbar featuring the Update and Cancel buttons.
Data Editing: Enter the new values within the enabled fields for the selected indicator.
Update: Click the Update button to confirm changes. Once the operation is complete, the main Tier Meeting L3 page will automatically update with the new parameters.
Cancel: Use the Cancel button to exit editing mode without saving any changes.
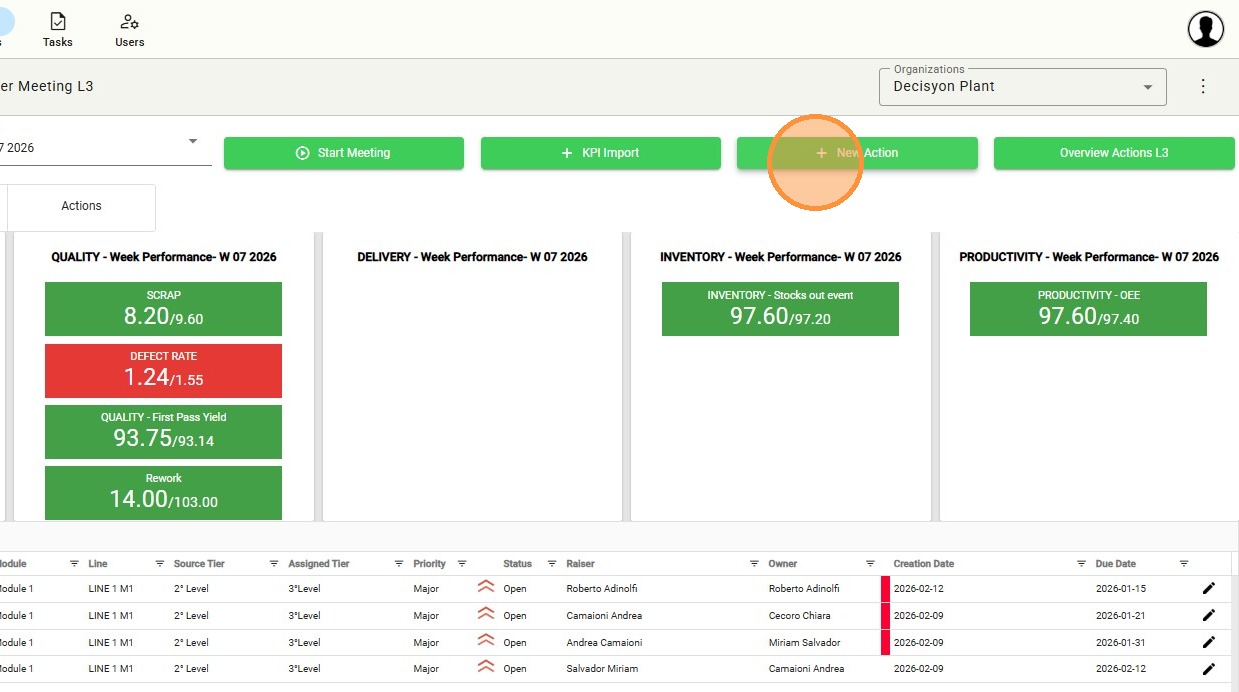
Create New Action
The "New Action" button facilitates the immediate recording of tasks or issues identified during the meeting.
The input form allows for the definition of key parameters for each newly created operational task

Module and Location: Select the Module, production Line, and Category to contextualize the event.
Hierarchy and Source: Define the Source Tier (origin level) and the Assigned Tier (the level to which the action is assigned for resolution).
Identification: Enter a descriptive Title for the Action.
Time Management: Verify the Creation Date (automatically set by the system) and use the calendar to select the Due Date (deadline) for task completion.
Responsibility: Identify the Owner (the user who opened the report) and the Raiser (the user assigned to handle the task).
Collaboration and Attachments: Use the right-hand section of the form to attach supporting files or initiate a chat to discuss action details in real time.
Once the new action is created, it will be displayed both in the report at the bottom of the page and in the "Actions Overview L3" section, provided that the assigned level remains unchanged. If the level is modified during creation, the action will only be visible within the dashboard of the corresponding Tier.
Overview Actions L3
To view the consolidated list of all Level 1 activities, select the "Overview Actions L3" button. This section provides a detailed view of all specific action, allowing for the monitoring of their status, priority, and assigned responsibilities.
L3 Overview Action List
To view the consolidated list of all Level 3 activities, select the "Overview Actions L3" button. This section provides a detailed view of every specific action, allowing for the monitoring of their status, priority, and assigned responsibilities; unlike the main dashboard, this view does not include a time-based filter, thereby displaying the full action log regardless of the creation date.

The table provides a detailed overview of all Level 1 activities, automatically filtered according to the Module and Line selected on the main page.
Full detailed information is displayed for each Action. At the end of each row, two management options are available:
Edit Button: Used to modify the content, deadlines, or assignees of the activity.
Meeting Management
In addition to data visualization and analysis, the board serves as an active tool for conducting coordination meetings. This section allows users to manage the session and ensure full traceability.
Initiating the Meeting
Within the dashboard, users can officially initiate the plant review session:
Start Meeting Command: Select the “Start Meeting” button to initiate the meeting registration and start the session timer.
Accessing the meeting interface opens a dedicated window where the session can be formally initiated using the Start Meeting button. The system automatically records the meeting based on the pre-configured operational parameters, including the Plant, functional Module, and the specific Tier level. This process ensures high data integrity as all contextual information is inherited directly from the main page, eliminating the need for manual entry and ensuring that every session is perfectly synchronized with its respective operational area.

Throughout the meeting, the system ensures continuous monitoring of the session duration via a digital clock that displays the elapsed time of the current Tier meeting in real time.
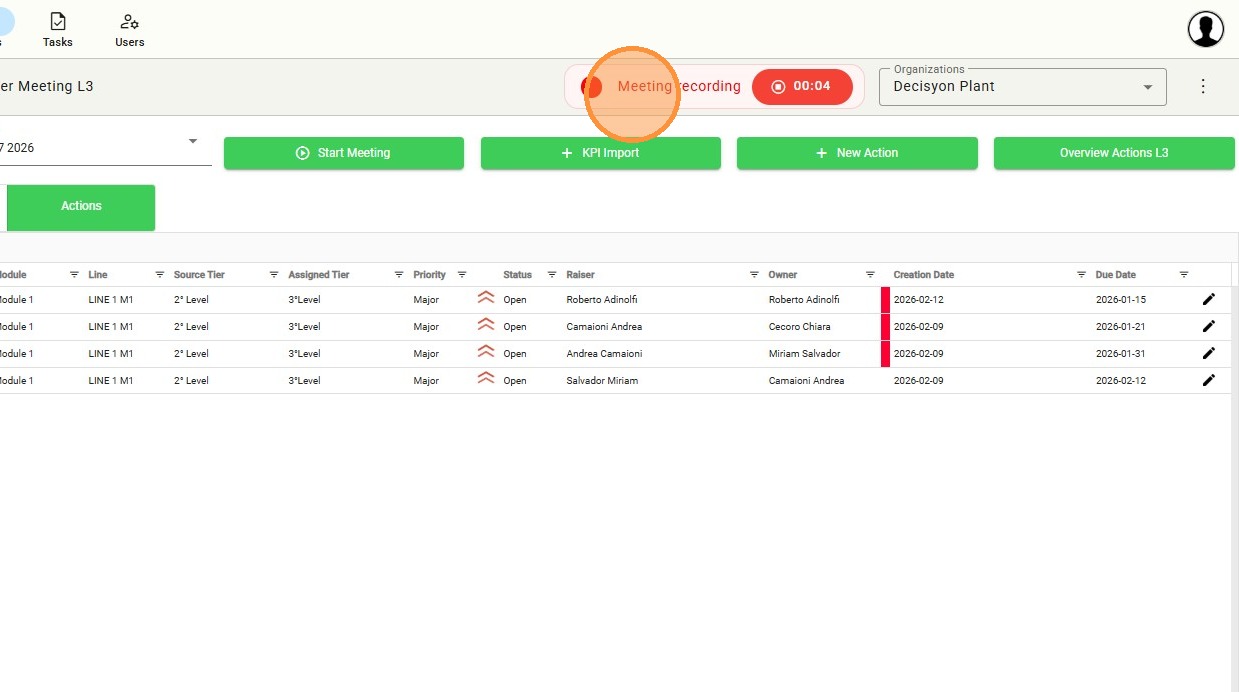
Once the meeting has commenced, the system actively facilitates process documentation by automatically recording the topics discussed, ensuring full traceability of the key points addressed. This feature provides a reliable and structured historical record of the decisions made and the priorities established by the team throughout the session.
Last updated